University of Liverpool
Type of resources
Topics
Keywords
Contact for the resource
Provided by
Years
Formats
Representation types
Update frequencies
-
A new family of spherical harmonic geomagnetic field models spanning the past 9000 yr based on magnetic field directions and intensity stored in archaeological artefacts, igneous rocks and sediment records. The pfm9k geomagnetic field models and datafiles as well as the individual bootstraps of the pfm9k.1b geomagnetic field model presented in A. Nilsson, R. Holme, M. Korte, N. Suttie and M. Hill (2014): Reconstructing Holocene geomagnetic field variation: new methods, models and implications. Geophys. J. Int., doi: 10.1093/gji/ggu120 are included here.
-
All the raw experimental data obtained for the study reported in Hodgson, E., Grappone, J. M., Biggin, A. J., Hill, M. J., & Dekkers, M. J. (2018). Thermoremanent behavior in synthetic samples containing natural oxyexsolved titanomagnetite. Geochemistry, Geophysics, Geosystems, 19. https://doi.org/10.1029/2017GC007354
-
P* data obtained through hydrostatic loading experiments, using triaxial experimental apparatus, as well as yield curve data obtained through differential loading tests, prior to the discovery of P* for different synthetic sandstones. The methodology used was taken from Bedford et al. (2018, 2019). Grain size analysis data obtained using a Beckman Coulter LS 13 320 laser diffraction particle size analyser. Particle analysis was conducted on five different synthetic sandstones with different grain size distributions. Secondary electron and backscatter electron SEM images for natural and synthetic sandstones. Secondary electron images were stitched together to form a whole core image. They were then binarised following the methodology of Rabbani and Ayatollahi. (2015). Hexagon grid size data used to obtain the correct grid size for performing porosity analysis across an mage using Fiji software (Brown, 2000). Bedford, J. D., Faulkner, D. R., Leclère, H., & Wheeler, J. (2018). High-Resolution Mapping of Yield Curve Shape and Evolution for Porous Rock: The Effect of Inelastic Compaction on 476 Porous Bassanite. Journal of Geophysical Research: Solid Earth, 123(2), 1217–1234. Bedford, J. D., Faulkner, D. R., Wheeler, J., & Leclère, H. (2019). High-resolution mapping of yield curve shape and evolution for high porosity sandstone. Journal of Geophysical Research: Solid Earth. Brown, G. O., Hsieh, H. T., & Lucero, D. A. (2000). Evaluation of laboratory dolomite core sample size using representative elementary volume concepts. Water Resources Research, 36(5), 484 1199–1207. Rabbani, A., & Ayatollahi, S. (2015). Comparing three image processing algorithms to estimate the grain-size distribution of porous rocks from binary 2D images and sensitivity analysis of the grain overlapping degree. Special Topics & Reviews in Porous Media: An International Journal, 6(1).
-
Fluid flow in the Earth: the influence of dehydration reactions and stress (NERC grant NE/J008303/1)
Text files of physical parameters controlled or measured in rock heating and deformation experiments; jpg and tif files of optical and electron microscope images of experimental products; xome xlsx spreadsheets related to data interpretation.
-
This dataset contains raw data from synthetic and experimental velocity steps analyzed using the MATLAB routine ‘steadystate.m’, as presented by Giacomel, P., Faulkner, D.R., Lambert, V., Allen, M.J (2024): ‘steadystate: A MATLAB-based routine for determining steady-state friction conditions in the framework of rate- and state- friction analysis’ – GSA, Geosphere. The data is provided in .zip folder containing the Velocity Steps and the outputs from steadystate.m, along with the scripts used to generate the figures shown in the Manuscript and Supplementary Material. The folder ‘Velocity_Steps’ notably contains the complete suite of mechanical data (subfolder ‘Mechanical_Data), the modelled rate- and state- friction parameters (subfolder ‘Modelled_RSF_Parameters SlipLaw’) obtained by assuming steady state at different displacements, as well as the linear detrended end members (i.e., at short to large displacements) fitted via inverse modelling (subfolder ‘Detrended_Velocity_Steps + Fit-Inversions’). Such observations were foundational for the development of the steadystate.m routine. Each subfolder is accompanied by a README.txt file that reports on the link between the raw .txt data with the MATLAB scripts generating the associated figures. For the sepiolite fault gouge used during the friction velocity steps, please refer to: Sánchez-Roa, C., Jiménez-Millán, J., Abad, I., Faulkner, D. R., Nieto, F., and García-Tortosa, F. J., 2016, Fibrous clay mineral authigenesis induced by fluid-rock interaction in the Galera fault zone (Betic Cordillera, SE Spain) and its influence on fault gouge frictional properties: Applied Clay Science, v. 134, p. 275-288.
-
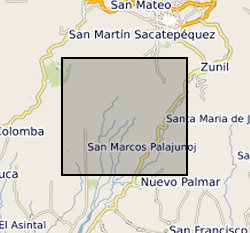
Continuous seismic waveforms from a network deployed at Santiaguito volcano between 2014 and 2015. Data are collected on broadband and short-period seismometers to record all volcanic activity for the period. Recorded data includes explosions, rockfalls and regional earthquakes.
-
Data files have .dat extension and can be opened with Notepad or any basic text editor software. Each file contains details of sample name, dimensions (length and diameter). All deformed samples were pre-prepared cylinders of synthetic neighbourite. Each file contains 11 data column as follows: Time (hours); Time (secs); CP (V); Vol (V); Force(V); Temp (V); Disp(V); Euro disp (mm); Furn T (mV); PoreP (mV); Furnace Power where V= Volts, mV= millivolts. The Calibration sheet (specific to the apparatus used) uploaded together with the data files is required to convert V and mV raw data into values of stress, strain, strain rate, confining pressure and temperature.
-
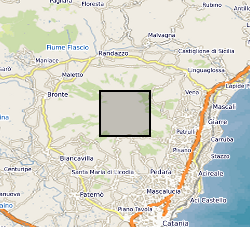
Infrasound Data collected at Volcan de Fuego (Guatemala) during three campaigns (May and November 2018, and June 2019). Associated article https://doi.org/10.3390/rs11111302
-

Seismic waveforms from an explosion catalogue from a seismic network at Santiaguito volcano between November 2014 and December 2018. A network of 6 broadband and 6 short-period stations was used to record explosive volcanic activity. Waveforms from 18,895 explosions have been automatically been detected and extracted.
-
The data are from a suite of friction experiments performed on 3 different grain size quartz gouges (5, 15 and 30 microns). The quartz gouge layers were sheared under a range of effective normal stresses (40-120 MPa), at a displacement rate of 1 micron/s, and the evolution of shear stress was monitored with increasing displacement (up to a maximum displacement of 8.5 mm). The gouges typically exhibit a transition from stable sliding, where the gouge layers shear in a continuous smooth fashion, to unstable sliding with displacement, where the gouges exhibit stick-slip behaviour. The transition from stable to unstable sliding occurs more efficiently in fine-grained quartz gouges and is promoted by high effective normal stresses.
 BGS Data Catalogue